Homework 3
Due Date: Friday, January 30, 2026 @ 11:59PM
Note There is no new GitHub classroom assignment for this homework. Please use the same repository as we have been using for previous homeworks.
Please do your work for Homework 3 in a new branch that you create (do not use the feedback branch or other existing branches). Create your new branch frommain.
Part 1: Setting Up The Debugger
In this part, you will set up the IDE-based debugger so that you can work on part 2 of this homework assignment.
First, select the debugger icon on the left and you should see the run and debug menu option (see image below).
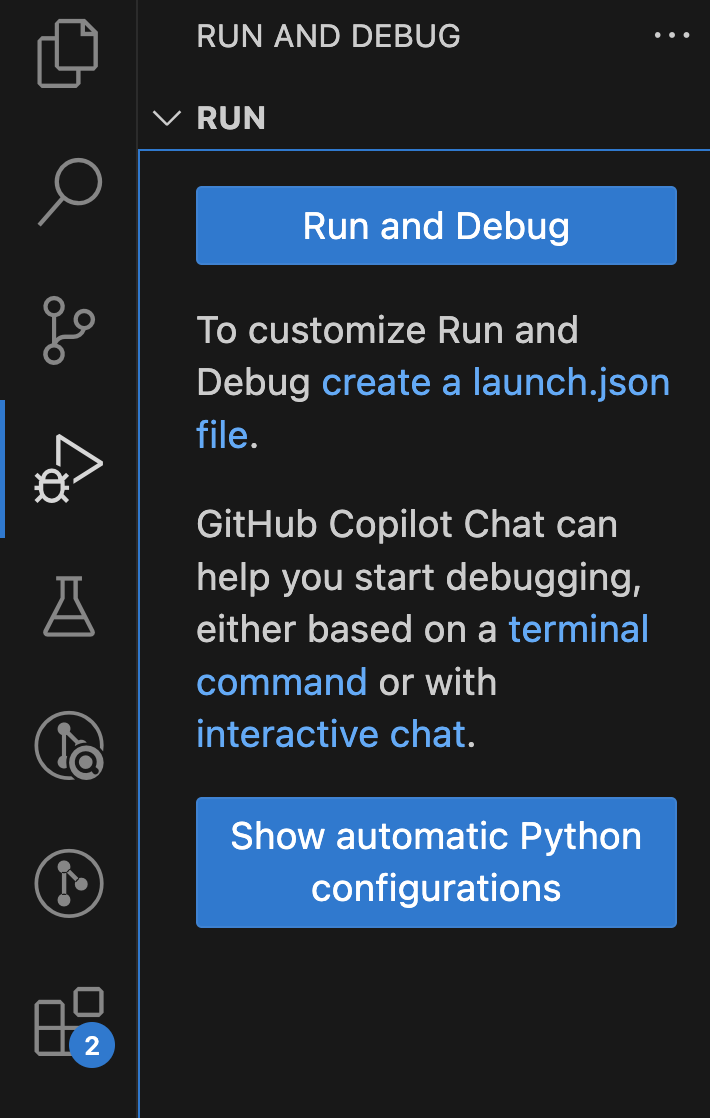
Second, click “create a launch.json file”. You will see a drop-down from the command palette with several options, such as Python Debugger and more.
Third, click on “Python Debugger” from this drop-down menu. A new set of option for the Debug Configuration will appear, such as Python File, Python File with Arguments, etc.
Fourth, select “Module” from this option.
Fifth, enter the module name as “idlelib”. You’ll be taken to a new file called “launch.json”.
Sixth, copy paste the following into the launch.json file (you can delete the auto-generated configuration and replace it with the following code):
{
    "version": "0.2.0",
    "configurations": [
        {
        "name": "Python Debugger: Module",
        "type": "debugpy",
        "request": "launch",
        "module": "idlelib",
        "justMyCode": false
        }
    ]
}
You can check if this works by selecting the Debugger icon on the left-hand pane and pressing the run button at the top of the Debugger pane.
IMPORTANT: Make sure that your python interpreter is set correctly to the python version you are using for this course (i.e., python 3.15 from your local development environment). You can check this by clicking on the python version in the bottom right corner of VS Code or by opening the command palette (Ctrl+Shift+P or Cmd+Shift+P) and searching for “Python: Select Interpreter”.
Task
Set a breakpoint inside the update_sidebar_text function in sidebar.py. Then, run the debugger and open a Python file in IDLE (File -> New File). You should see that the debugger stops at your breakpoint. Take a screenshot of your debugger with the breakpoint hit and include it in your process journal.
Part 2: Analyzing the Reformat Paragraph Function Using the Debugger
Motivation
When developing features, developers sometimes leave comments marking future work or ideas to complete. In the IDLE codebase, these “TODO” comments are marked with XXX
The Reformat Paragraph feature from previous assignments has some of these comments. Take a look at the reformat_paragraph function and see this comment:
# XXX Should reformat remaining paragraphs as well
What does this mean? Let’s test the feature out.
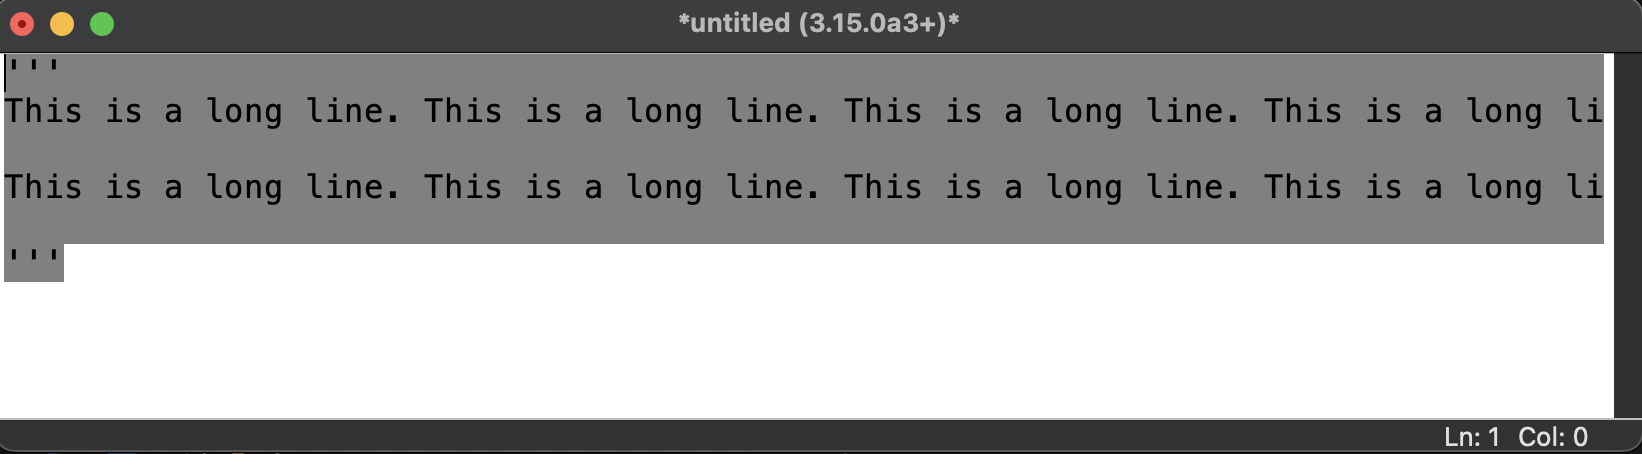
If I input a string like this to the editor, then use the Reformat Paragraph feature with the text selected, I see this after:
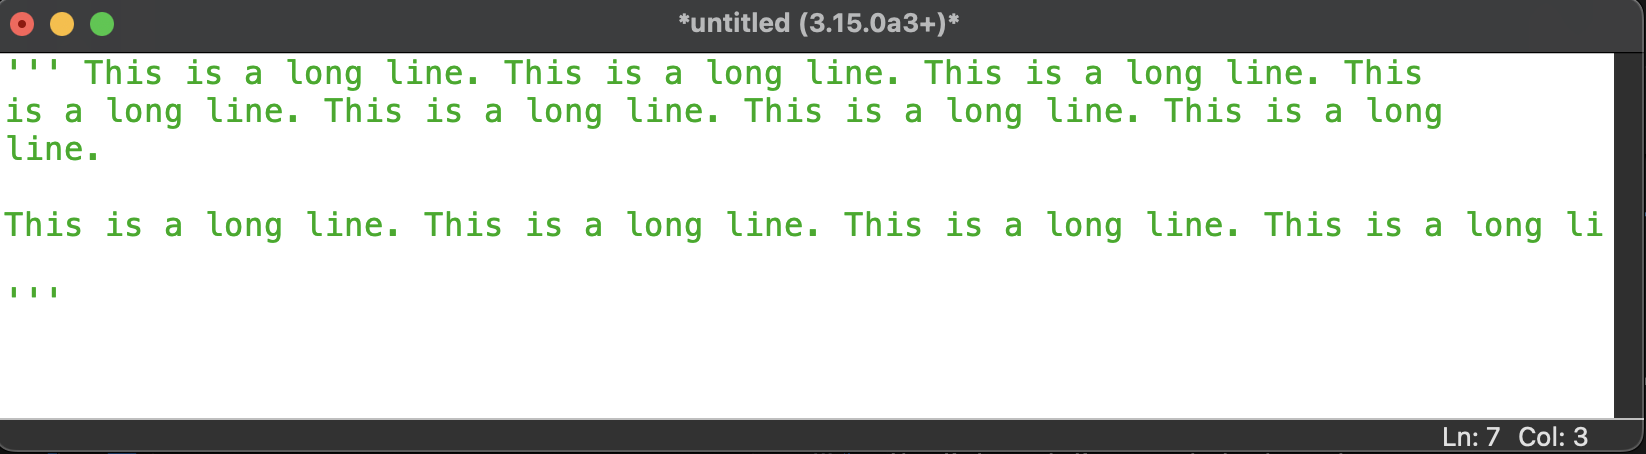
Only the first paragraph got formatted! Users might expect everything within a highlighted area to be formatted, not just the first paragraph.
Let’s say you are a new developer tasked with addressing this XXX comment, allowing users to format everything within a selection. Jumping straight into code comprehension can be difficult, especially with many conditionals, functions called, and while loops. When it comes to understanding complex logic, the debugger is a useful tool to use.
Task
Create a new section in your process journal for your Part 2 answers. This activity will guide you through how to use the debugger to understand why the bug exists.
Part 2A: Descriptive Variable Names
When first working on a feature, it can be useful to temporarily rename variables for yourself on your local copy to keep track of how the code works.
Rename the following variables inside of the reformat_paragraph function. In your process journal, provide a short description of the 1) old variable name (that is currently in the reformat_paragraph function), 2) new variable name (the new variable name you chose), 3) the data type of this variable, and 4) how that variable is used in the function (i.e., purpose of the variable in reformat_paragraph). Also, describe how you used the debugger to understand the function. Use screenshots of the debugger panel to justify your responses in your process journal.
partial:word:words:new:j:n:
Part 2B: Using The Watch Tab
With a clearer understanding of what the variables do, now answer: “Why does reformat_paragraph not format all paragraphs within its selection? Why does it only format the first paragraph?”
To justify your answer, create a list of variables in the Watch tab of the debugger and screenshot the debugger panel at various points of execution. Include at least one expression in your watch list that is not included in the default variables section list.
Pull Request
In your pull request for this homework assignment, include the code changes you made to rename the variables above. Make sure to follow proper git commit message conventions when committing your changes.
Part 3: Show Code Outline
Motivation
We hope to add a new feature to our IDLE editor window that performs static code analysis of a region of code that is highlighted by the user. Static code analysis can refer to any analysis of the code structure, syntax, and quality of the written source code rather than analysis of the code performance during runtime. Static code analysis can have a variety of uses, such as discovering security vulnerabilities, promoting standard coding conventions, and understanding the code structure. We want to implement a static code analyzer as an added feature to our codebase. Eventually, we want this feature to be able to perform complex security-related analysis and identify violations of code standards. However, to adhere to an incremental approach to developing this feature, your team will initially be tasked with adding the option to simply show the code outline by doing an analysis of the code structure.
Task
Your specific task will be to add a menu item to the IDLE editor under Options that says Show Code Outline. This option should ONLY be visible when the Python Editor Window is open (i.e., not the Python shell).
When a user selects this option when they have selected/highlighted a region of code, the Code Outline for the selected/highlighted lines should appear in the IDLE shell.
When a user selects this option when they have not selected/highlighted any code, the Code Outline for the entire Python file should appear in the IDLE shell.
The button should also have a key binding (i.e., there should be a keyboard shortcut to invoke the Show Code Outline option). You are free to choose which specific keyboard shortcut you choose to attach to your added feature.
When Show Code Outline is selected, the Python shell should display only the classes and methods in the Python file (you can assume it is always a Python file that this will be performed on). Specifically, the outline should look like:
func: sampleFuncName0
class: SampleClassName
    func: sampleFuncName1
        func: innerFunc
    func: sampleFuncName2
Note that the level of indentation should match between the outline and file (i.e., you should be able to process functions outside of classes, functions within functions, etc.)
Sometimes, there may be code with no functions or classes. Think about how you want to handle such an edge case and defend your reason for making that design decision.
Note: You do not need to handle edge cases with function definitions in multi-line strings. For instance:
def foo():
    """
    def not_a_real_function():
        pass
    """
    pass
Submission
Please submit this by 11:59PM on Friday, January 30, 2026. In the final pull request description, please use the Pull Request template. Along with adding screenshots, you will be making a short video demonstrating the feature in action (see below).
For part 3, also submit a UML diagram in your process journal that can be used to understand your new feature.
Video
In addition to the Pull Request, please make a video that is no longer than 1 minute (it can certainly be shorter). The video should:
- Show that the code runs, the menu option is there
- Show the outline feature when code is highlighted (you should show a couple different situations)
- Show the outline feature when no code is highlighted
The video is best done on a private Zoom room, where you share your screen and record the meeting. Then, you can download the video and upload it (to either Google Drive or Youtube), and include the link to the video in your pull request description. Please make sure to have the correct permissions on your video so that the course staff will be able to view it.
Documentation (Process Journal):
Project Folder: Create a folder named “Homework 3”. Please use the instructions for the Process Journal to create that file for your submission.
Submission Checklist: https://docs.google.com/document/d/11on33qbZkkelfUefdRsaJ4fiNoqSSt-OQg-QlKC-Vco/edit?usp=sharing